$ cat project.json
FlowSight
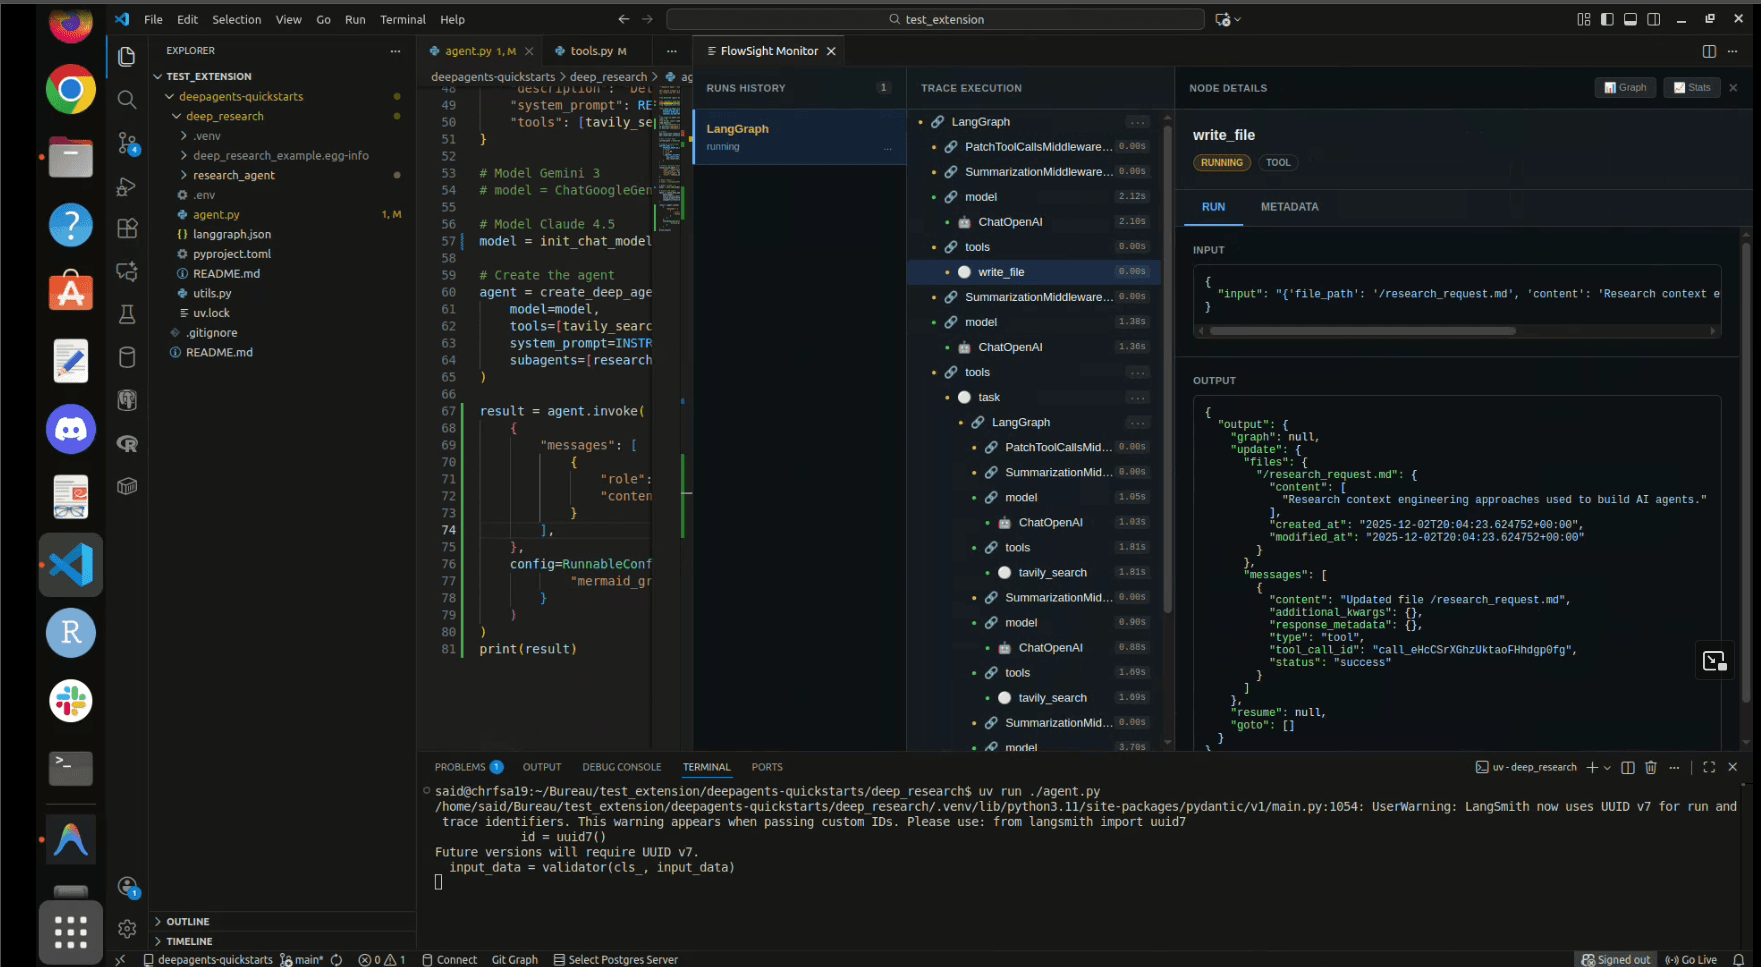
FlowSight is a local VS Code extension that provides "X-Ray vision" for your LangChain and LangGraph agents. It visualizes traces, metadata, and execution graphs in real-time, right next to your code.
tech_stack:
Why FlowSight?
Debugging AI agents often feels like a black box. You see the input and output, but the intermediate steps—reasoning, tool calls, loops—are lost in terminal logs.
FlowSight solves this by:
- Tracing Everything: Capturing every JSON input/output and metadata field live.
- Visualizing Logic: Rendering your LangGraph structure dynamically as it runs.
- Local Privacy: Running entirely on
localhost:1984. No data leaves your machine.
Installation (Local)
Since this extension is currently in preview, you can install it locally from the source or a .vsix file.
- Download the
.vsixfile (or build it yourself). - Open VS Code.
- Run the command:
Extensions: Install from VSIX... - Select the
flowsight-0.0.1.vsixfile.
Usage
FlowSight works by intercepting standard LangChain traces. You don't need to change your code; just set the environment variables to point to the FlowSight local server.
1. Open the FlowSight Monitor
In VS Code, open the Command Palette (Ctrl+Shift+P or Cmd+Shift+P) and run:
FlowSight: Open Monitor
This will open the dashboard and start the local server on port 1984.
2. Configure Your Agent
Set the following environment variables in your terminal or .env file before running your LangChain/LangGraph script:
export LANGCHAIN_TRACING_V2=true
export LANGCHAIN_ENDPOINT="http://localhost:1984"
export LANGCHAIN_API_KEY="ls__..." # (Optional, can be any string)
export LANGCHAIN_PROJECT="default" # (Optional)
3. Run Your Agent
Execute your Python or Node.js script as usual.
python my_agent.py
You will see the traces appear instantly in the FlowSight panel! 🚀
Features
- Waterfall View: See the step-by-step execution timeline.
- Graph Visualization: Auto-generated Mermaid diagrams of your workflow.
- Deep Inspection: Click any node to inspect raw JSON inputs, outputs, and token usage.
- Stats: View latency, token counts, and status for every run.